Debugging Basics
Opening the Dev Menu
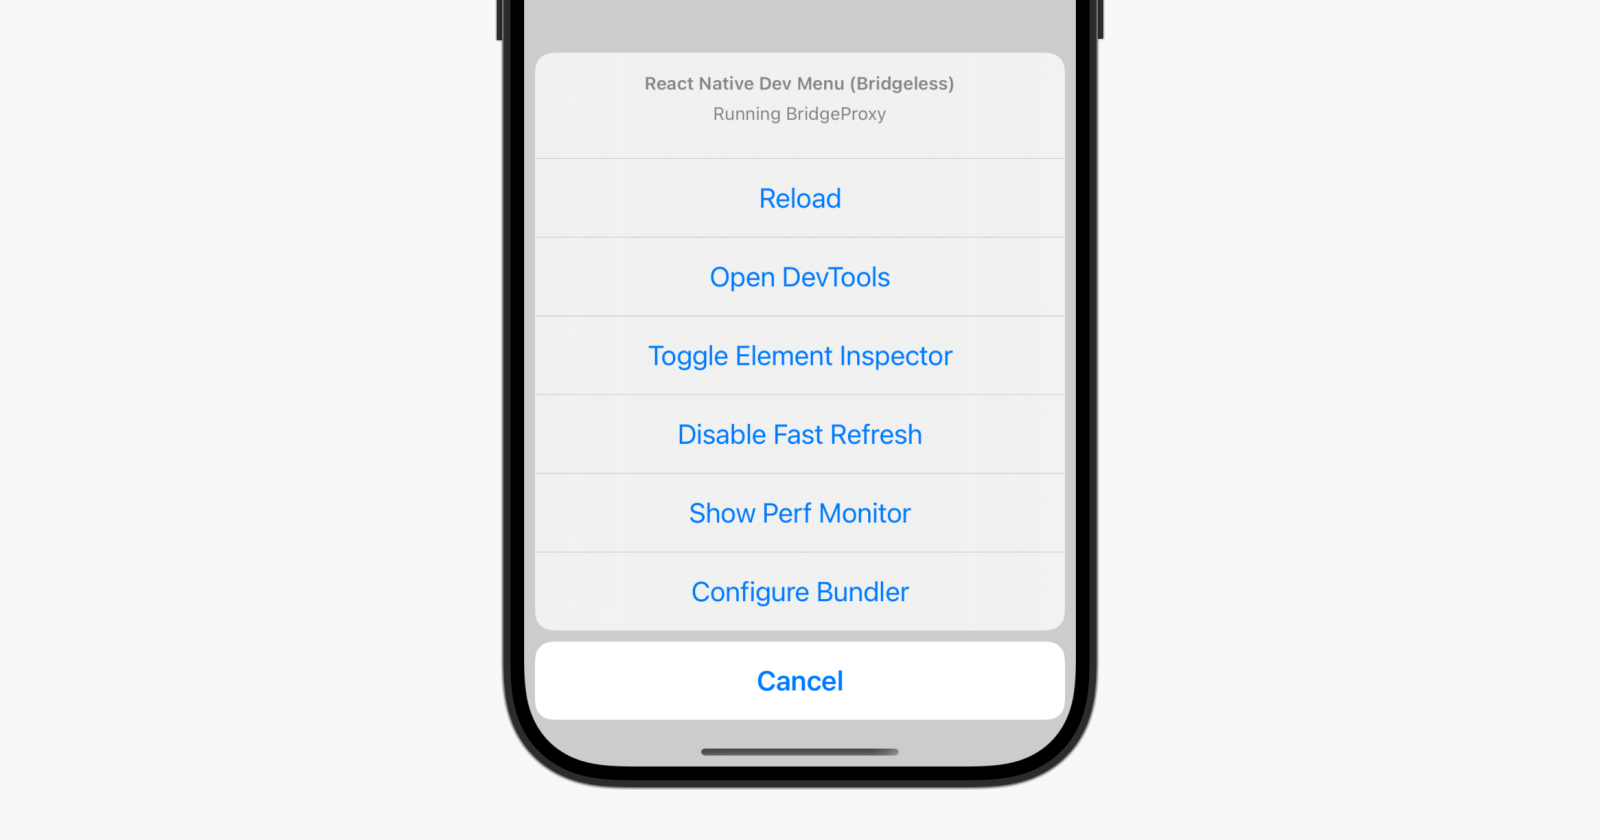
React Native provides an in-app developer menu which offers several debugging options. You can access the Dev Menu by shaking your device or via keyboard shortcuts:
- iOS Simulator: Cmd ⌘ + D (or Device > Shake)
- Android emulators: Cmd ⌘ + M (macOS) or Ctrl + M (Windows and Linux)
Alternatively for Android devices and emulators, you can run adb shell input keyevent 82 in your terminal.

The Dev Menu is disabled in release (production) builds.
Opening DevTools
React Native DevTools is our built-in debugger for React Native. It allows you to inspect and understand how your JavaScript code is running, similar to a web browser.
To open DevTools, either:
- Select "Open DevTools" in the Dev Menu.
- Press j from the CLI (
npx react-native start).
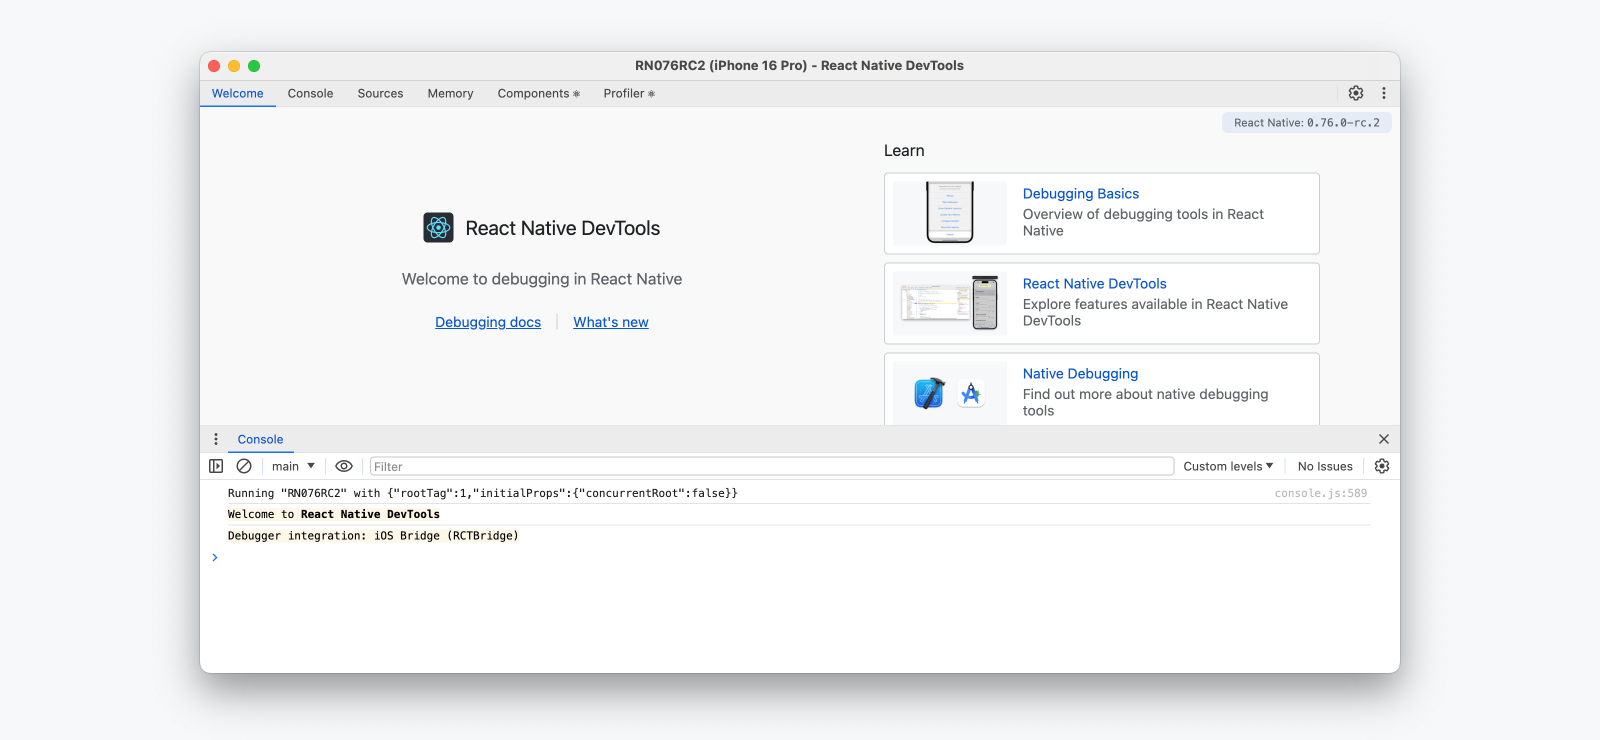
On first launch, DevTools will open to a welcome panel, along with an open console drawer where you can view logs and interact with the JavaScript runtime. From the top of the window, you can navigate to other panels, including the integrated React Components Inspector and Profiler.

React Native DevTools is powered by a dedicated debugging architecture built into React Native and uses a customized build of the Chrome DevTools frontend. This enables us to offer familiar, browser-aligned debugging features that are deeply integrated and built for end-to-end reliability.
Learn more in our React Native DevTools guide.
React Native DevTools is only available with the Hermes engine, and requires either Google Chrome or Microsoft Edge installed.
Flipper and alternative debugging tools
React Native DevTools replaces the previous Flipper, Experimental Debugger, and Hermes debugger (Chrome) frontends. If you are on an older version of React Native, please go to the docs for your version.
We continue to offer legacy debugging methods such as Direct JSC Debugging and Remote JS Debugging (deprecated) (see Other Debugging Methods).
React Native DevTools is designed for debugging React app concerns, and not to replace native tools. If you want to inspect React Native’s underlying platform layers (for example, while developing a Native Module), please use the debugging tools available in Xcode and Android Studio (see Debugging Native Code).
Other useful links:
LogBox
LogBox is an in-app tool that displays when warnings or errors are logged by your app.

LogBox is disabled in release (production) builds.
Fatal Errors
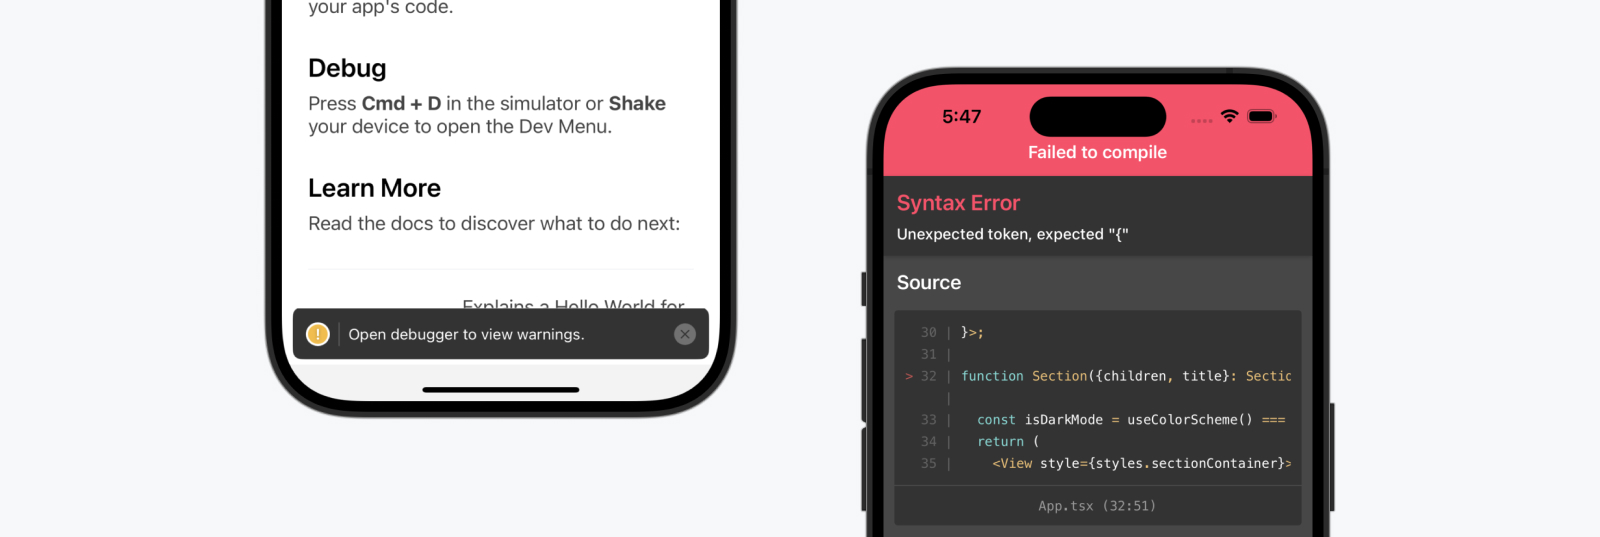
When an unrecoverable error occurs, such as a JavaScript syntax error, LogBox will open with the location of the error. In this state, LogBox is not dismissable since your code cannot be executed. LogBox will automatically dismiss once the syntax error is fixed — either via Fast Refresh or after a manual reload.
Console Errors and Warnings
Console errors and warnings are displayed as on-screen notifications with a red or yellow badge.
- Errors will display with a notification count. Tap the notification to see an expanded view and to paginate through other logs.
- Warnings will display a notification banner without details, prompting you to open React Native DevTools.
When React Native DevTools is open, all errors except fatal errors will be hidden to LogBox. We recommend using the Console panel within React Native DevTools as a source of truth, due to various LogBox options which can hide or adjust the level of certain logs.
💡 Ignoring logs
Performance Monitor
On Android and iOS, an in-app performance overlay can be toggled during development by selecting "Perf Monitor" in the Dev Menu. Learn more about this feature here.

The Performance Monitor runs in-app and is a guide. We recommend investigating the native tooling under Android Studio and Xcode for accurate performance measurements.