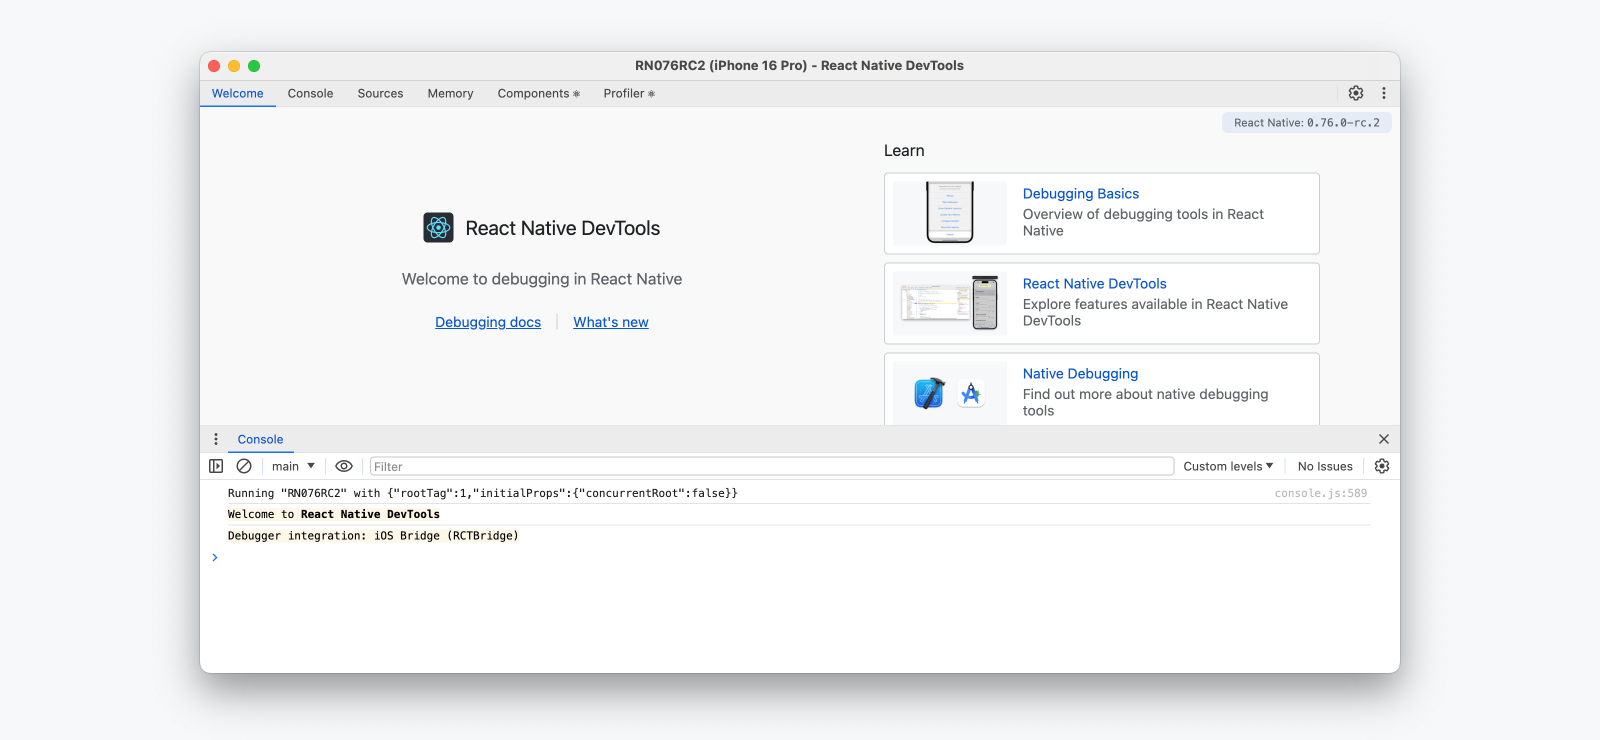
React Native DevTools
React Native DevTools is our new debugging experience featuring an end-to-end rewrite of our debugger stack. It aims to be more deeply integrated and fundamentally more reliable than previous debugging methods in React Native.
React Native DevTools is designed for debugging React app concerns, and not to replace native tools. If you want to inspect React Native’s underlying platform layers (for example, while developing a Native Module), please use the debugging tools available in Android Studio and Xcode (see Debugging Native Code).
💡 Compatibility — released in 0.76
💡 Feedback & FAQs
Core features
React Native DevTools is based on the Chrome DevTools frontend. If you have a web development background, its features should be familiar. As a starting point, we recommend browsing the Chrome DevTools docs which contain full guides as well as video resources.
Console
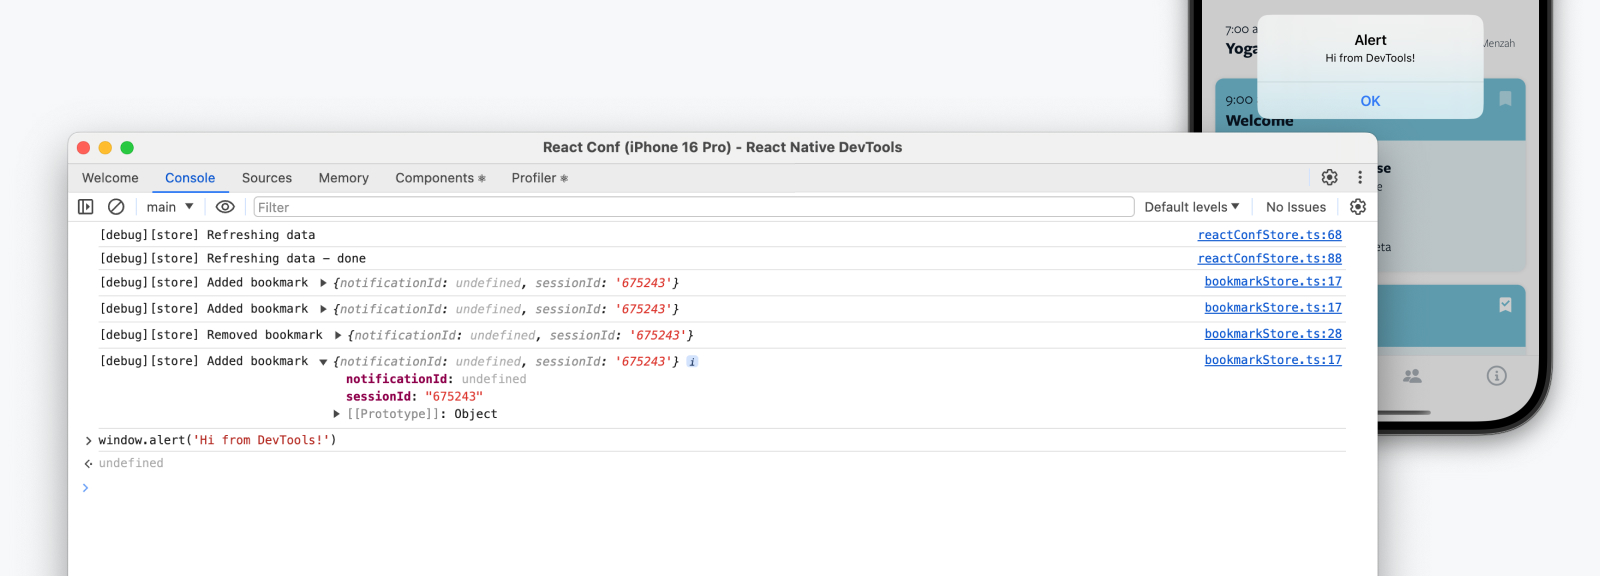
The Console panel allows you to view and filter messages, evaluate JavaScript, inspect object properties, and more.
Console features reference | Chrome DevTools
Useful tips
- If your app has a lot of logs, use the filter box or change the log levels that are shown.
- Watch values over time with Live Expressions.
- Persist messages across reloads with Preserve Logs.
- Use Ctrl + L to clear the console view.
Sources & breakpoints
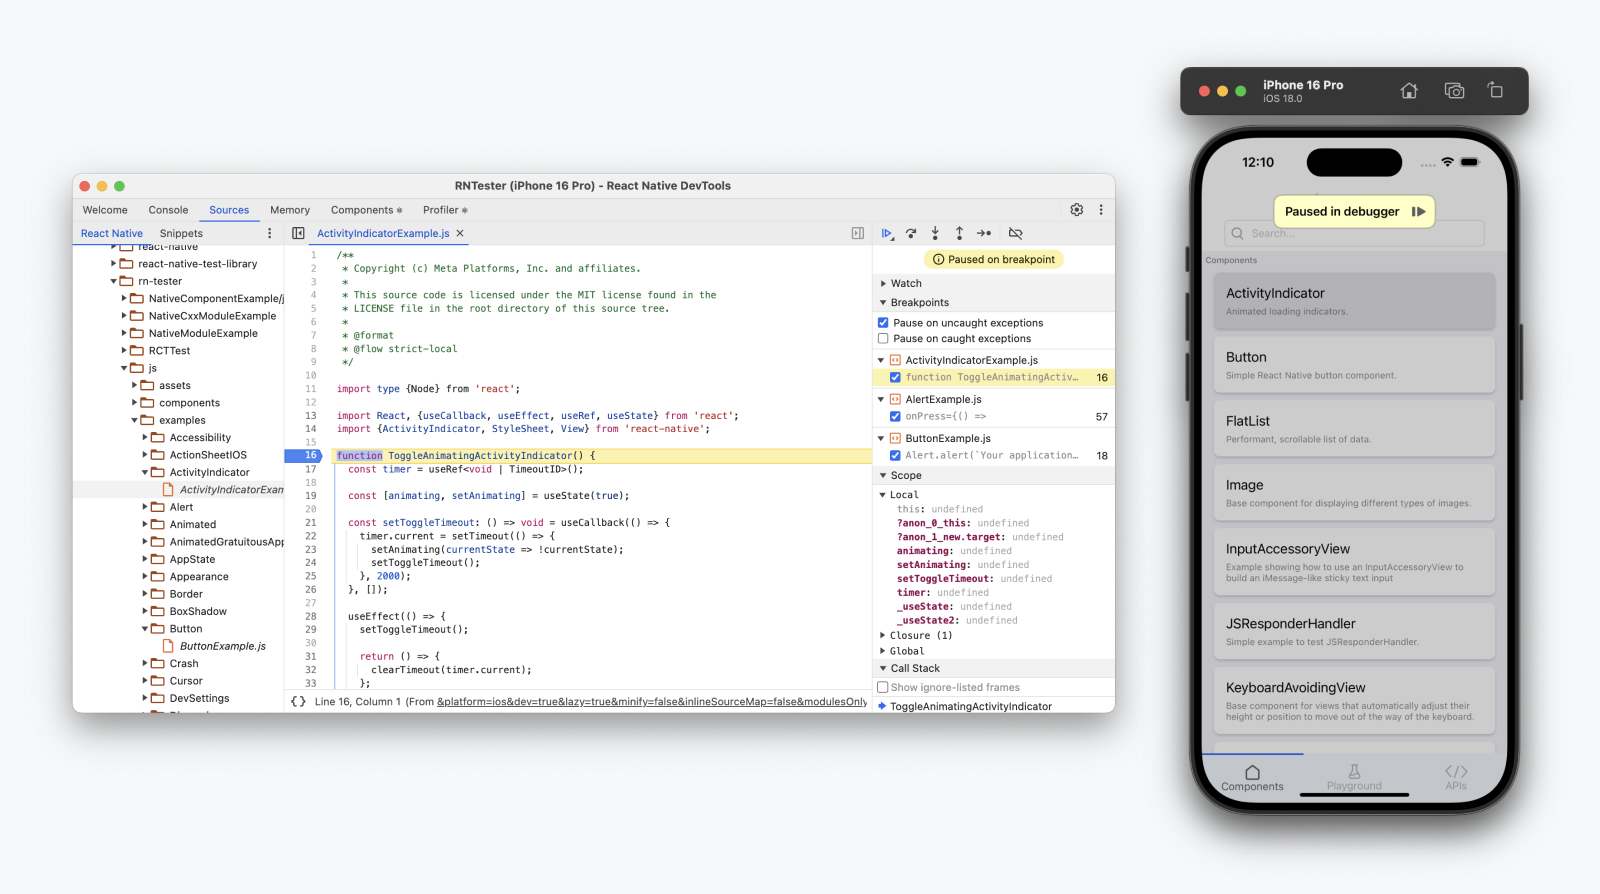
The Sources panel allows you to view the source files in your app and register breakpoints. Use a breakpoint to define a line of code where your app should pause — allowing you to inspect the live state of the program and incrementally step through code.
Pause your code with breakpoints | Chrome DevTools
Mini-guide
Breakpoints are a fundamental tool in your debugging toolkit!
- Navigate to a source file using the sidebar or Cmd ⌘+P / Ctrl+P.
- Click in the line number column next to a line of code to add a breakpoint.
- Use the navigation controls at the top right to step through code when paused.
Useful tips
- A "Paused in Debugger" overlay will appear when your app is paused. Tap it to resume.
- Pay attention to the right hand side panels when on a breakpoint, which allow you to inspect the current scope and call stack, and set watch expressions.
- Use a
debugger;statement to quickly set a breakpoint from your text editor. This will reach the device immediately via Fast Refresh. - There are multiple kinds of breakpoints! For example, Conditional Breakpoints and Logpoints.
Reconnecting DevTools
Occasionally, DevTools might disconnect from the target device. This can happen if:
- The app is closed.
- The app is rebuilt (a new native build is installed).
- The app has crashed on the native side.
- The dev server (Metro) is quit.
- A physical device is disconnected.
On disconnect, a dialog will be shown with the message "Debugging connection was closed".
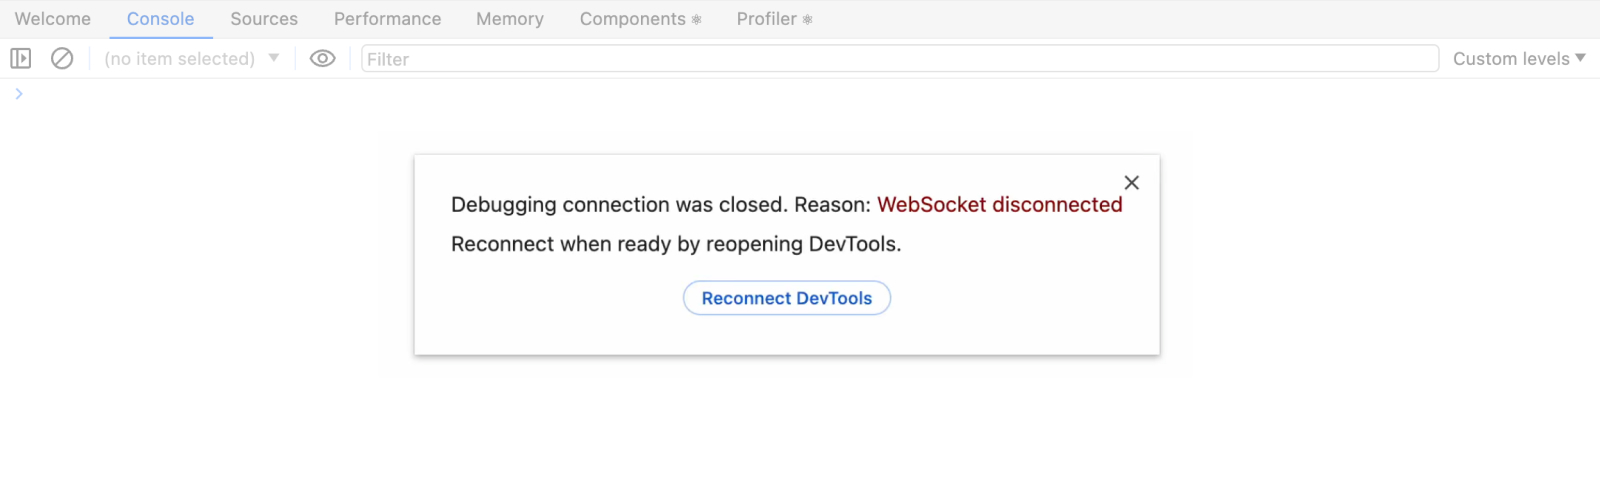
From here, you can either:
- Dismiss: Select the close (
×) icon or click outside the dialog to return to the DevTools UI in the last state before disconnection. - Reconnect: Select "Reconnect DevTools", having addressed the reason for disconnection.